Evaluation guidance - analysing your evidence

Step 3: Analysing your evidence
Taking an outcomes approach: from planning to evaluation
Once you’ve collected all your data, the next step is to analyse it.
Analysis is the process of converting your raw data—such as assessment forms, photos, and video diaries—into useful information to help you monitor and evaluate your project. This information can then be used as evidence of your progress toward your intended outcomes.
Raw data alone isn’t very informative. It’s only when you take the time to carefully understand what it shows that findings become clear. When reporting on the outcomes of your project, you need to analyse the data in order to guide your reader, pointing out the trends and patterns that you’ve identified so that they understand how you reached your conclusion.
Start by analysing the evidence for each indicator separately
For example, you might have chosen to measure participants’ employability skills by using two different data collection tools:
- Evaluation scales showing participants’ self-assessment of their employability skills
- Evaluation scales showing the music leaders’ assessment of the participants’ employability skills
You should analyse the evaluation scales from each group separately rather than combining them into a single numerical analysis, because each indicator represents a different perspective.
As you analyse your evidence, keep sense-checking your findings to see if they fit with your overall impressions and expectations. This will help you to avoid errors in your analysis and understand the limitations of your data. It will also mean that can you to examine your initial impressions and think about whether they’re reflected in reality.
Quantitative evidence can be a useful way of showing overall progress toward an intended outcome across the cohort of participants on your project. In order to show this progress, you first need to convert your raw data into averages and trends. This section will look at two different ways of analysing your quantitative data: by level of change and by likelihood of change.
In this example, a project has measured participants’ self-assessment of their team-working skills by collecting evaluation scales from them at half-termly intervals. (Notice that this table only includes participants for whom a full data set is available. For the purposes of this example, the participant names have been included – however for a real data set it would be important to redact any identifying characteristics of your sample).
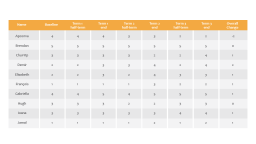
Using this data you can calculate a number of different things:
- The average rating of all participants at each data collection point
- The overall change for each participant
- The average overall change for all participants
To measure these ratings and changes, you firstly need to simplify the figures into averages.
- The mean average is calculated by adding up all the values and dividing by the number of values. The mean is more commonly used but can be skewed by a small number of outlying values.
- The median average is calculated by arranging the list of numbers from smallest to largest, then choosing the figure in the middle. (If there is an even number of numbers in a list, it is calculated as the mean of the two middle values.)The median is often a better indication of what is typical, but it works best when you have a large data set.
- You’ll need to decide which average is more meaningful to use for your particular data set. The table below shows both types of averages, but the rest of this analysis will use the mean average.
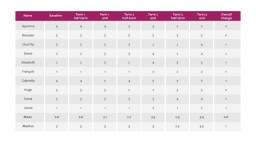
Once you’ve calculated the averages, you’ll start to notice trends and patterns.
For example:
- Seven out of 10 participants’ ratings were higher at the end of the project than at the beginning of the project. Two participants’ ratings were the same at the beginning and the end of the project. One participant’s rating went down from the beginning to the end of the project. This means that overall, 70% of participants believed that their team-working skills had improved through this project.
- The average overall rating was highest at the end of each term.
- Overall, participants’ ratings did go up over the course of the project, with an average change of 0.6.
You can also visualise this data by creating a chart. The example below includes both a line chart of the average self-assessment rating at each point (in blue) and a trend line (in red) showing the general course of progress toward the intended outcome.
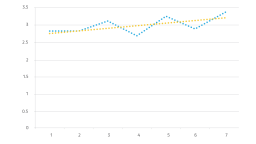
The trend line makes it easier to see the overall direction and rate of travel toward the outcome. It also allows you to pinpoint when the actual averages outperformed or underperformed the trend. As you can see in the chart above, although the average self-assessment rating fluctuates over the course of the project, there is a slight upward trend overall. This confirms the calculated average increase of 0.6 out of 5 in their self-assessment rating.
Depending on what types of data you collected and the size of your data set, there may also be other useful ways of analysing your evidence, such as calculating the mode average (the most frequently occurring value) or the range (the difference between the highest and lowest values).
Qualitative data tools can seem overwhelming. For example, if you’ve collected reflective diaries from the participants with self-evaluations of their progress through the project, you may find that the diaries contain lots of information that doesn’t relate to any of your outcomes. You may also find that the diaries contain reflections relating to musical, personal, and social outcomes—all combined together within the same entry.
Coding your data
The first step in analysing qualitative evidence is to identify which data relates to the particular outcomes that you are measuring. You can do this by coding your data.
- Coding is the process of labelling your data so that it can be easily retrieved at a later stage for further analysis. It’s similar to using a hashtag on social media. People who are interested in a particular topic can search for that hashtag to find all posts related to that topic, and your use of that hashtag will ensure that your post shows up in their search results. Similarly, the purpose of coding evaluation data is to develop a way to easily find all the data labelled with a particular code and see it all in one place.
- Your coding method can take many different forms, and you can do it at the end of your project or as you go along.
- For example, if the reflective diaries are in notebooks, you can code relevant parts of an entry using a different coloured sticky tab for each code. When you want to find everything related to a given code, you can scan through all the notebooks for entries with the corresponding colour of sticky tab.
- If you prefer to work electronically, you can create a spreadsheet to keep track of all the data you have against your coding scheme (see table below). You can then use a filter to find all the data linked to a given code. Your organisation may also have specialist qualitative data analysis software that you can use for coding. Your choice of method will depend on the amount of data you’re collecting, the number of people analysing the data, and your preferred way of working.
- Start by coding your data against your intended outcomes. Work carefully through the data that you’ve collected, and apply codes to the parts of the data that are relevant to each outcome – whether that data is positive or negative.
- If parts of the data are relevant to more than one outcome, apply a separate code for each outcome.
- Ensure you only code parts of the data that are relevant to your outcomes. If parts of the data aren’t relevant to any of your outcomes, they don’t need to be coded, but you might want to flag them up to come back to later if you notice anything else particularly interesting appearing in the data set.
- Remember that your participants (or whoever else is filling in the diary) may not be using the same language as you. For example, in the table below, the first outcome concerns 'employability skills' – however, the young people are unlikely to use this term, so you may need to read between the lines for things that they've written about working with others, patience, motivation etc.
- At this stage, don’t stop and try to analyse your evidence. Just keep going until you’ve coded all the relevant data against your intended outcomes.
Data collection tool
- Reflective diary
Respondent
- Apoorva
Date collected
- Session 1 – 10 September
Content
"When I went in the room and saw all the different equipment I didn’t really know what I was doing there, I wasn’t drawn to anything in particular. We got shown round all the different bits of equipment and started working with a sound editing computer programme but I got annoyed at myself because I couldn’t think of anything I wanted to do and someone else in my group seemed to get the hang of it really quick. Mine sounded rubbish but it was interesting to get the chance to see it all on the screens."
Code
- Outcome 1 – To improve the employability skills of young ex-offenders
Data collection tool
- Reflective diary
Respondent
- Apoorva
Date collected
- Session 15 – 17 December
Content
"I’ve just finished recording the first song for my Arts Award portfolio, it’s my mates playing Chasing Cars. At one part of the day I could feel myself getting annoyed with them because they kept getting this one bit wrong. But it will take me a while to get it edited anyway so I can always go back and ask them to redo it if it sounds bad. I’m excited to get started on the mix."
Code
- Outcome 1 - To improve the employability skills of young ex-offenders
Data collection tool
- Reflective diary
Respondent
- Apoorva
Date collected
- Session 1 – 10 September
Content
- No data relating to Outcome 2.
Code
- Outcome 2 – To increase young ex-offenders’ confidence in applying for jobs
Data collection tool
- Reflective diary
Respondent
- Apoorva
Date collected
- Session 15 – 17 December
Content
"I was late to the session today because I got held up after an interview I had to get trained up to be a mentor for kids who are in trouble like I was but once I caught up I managed to get quite a bit recorded for my track."
Code
- Outcome 2 – To increase young ex-offenders’ confidence in applying for jobs
Reviewing and analysing your data
Once you’ve finished coding your data, you can then review everything you’ve coded under each particular outcome and analyse its content.
As you review the data, keep an eye out for trends and patterns.
For example, if analysing reflective diaries, you would read all the coded data from the entries at the beginning of the project and compare it with the coded data from the entries in subsequent sessions and at the end of the project. How does the participants’ self-evaluation of their employability skills change throughout the project?
Different ways of reading the data will give you different understandings of the group’s collective and individual progress toward this outcome. You may also choose to read through the diary entries for each participant in chronological order to get a better feel for their individual journeys through the project.
When reviewing your data, remember that you are looking for evidence of progress toward the intended outcome.
With the reflective diaries, this would involve comparing their diary entries at the beginning of the project (i.e. your baseline) and end of the project. For example, you may find that at the beginning of the project, participants talked about their employability skills in more negative terms, and by the end of the project, their reflections became more positive.
In any piece of qualitative research, you are looking to explore the range of experiences and opinions across the participants, not the number. Both positive and negative views are an important part of the picture and are equally valid and as such should be given equal weighting in your discussion.
Session 1: 10 September
- Apoorva – "When I went in the room and saw all the different equipment I didn’t really know what I was doing there, I wasn’t drawn to anything in particular. We got shown round all the different bits of equipment and started working with a sound editing computer programme but I got annoyed at myself because I couldn’t think of anything I wanted to do and someone else in my group seemed to get the hang of it really quick. Mine sounded rubbish but it was interesting to get the chance to see it all on the screens."
- Brendan – "To be honest I’m not sure if it’s my thing. It was a bit boring and I’m not very creative so I’ll try it for a few more weeks because my youth worker is making me but my gut feeling is that it’s not for me."
Session 15: 17 December
- Apoorva – "I’ve just finished recording the first song for my Arts Award portfolio, it’s my mates playing Chasing Cars. At one part of the day I could feel myself getting annoyed with them because they kept getting this one bit wrong. But it will take me a while to get it edited anyway so I can always go back and ask them to redo it if it sounds bad. I’m excited to get started on the mix."
- Brendan – "I spent most of the session helping Gabriella with a bit of her mix because I'm a bit further ahead than her and she was struggling with some of the equipment. She said at the end that she was glad we worked together because she wasn't really enjoying herself before I started helping her and that made me proud of myself for sticking it out."
(Example qualitative data comparison: beginning and end of project)
In diary entries from the end of the project, participants might reflect on how far they think they’ve progressed since the start. This can be particularly useful if baseline data is missing for any individual.
- "When I first started here, I thought it was boring and I could have sworn I was going to stop coming at the first possible point. Now I’ve written 2 songs and I’m working on my third, and the music leader thinks I should start recording them next term so I can have something to be really proud of."
If you have a large data set, you may find it helpful to visualise your data by creating a word cloud showing the most frequently used words at the beginning of the project and comparing it with a word cloud showing the most frequently used words at the end of the project:


Drawing conclusions
As you review the coded data and start to identify trends and patterns, write down your initial thoughts and observations.
Review your data again, and check that the data supports your analysis. If not, ask yourself how you can revise your analysis to make it better reflect your data. You can also ask a colleague to explore the data and check your analysis to see if they reach the same conclusion.
Keep in mind that although the data might seem to relate to an area of change, it might not necessarily provide evidence of progress toward the intended outcome. For example, this quote from a music leader’s final assessment of a participant at first appears to provide evidence of a musical outcome:
- "Jamal loved jamming on the guitar and would often sign out one of the centre’s guitars to take home. His mum told the youth workers that he would practice for hours at home every night, working on material that we had learned in that week’s session."
This quote tells us about Jamal’s love of the instrument, but it does not tell us whether he progressed in his enjoyment of music-making or his technical skills on the guitar. In order for this quote to be meaningful, it would need to be paired with evidence showing that the participant previously had no interest in music-making or that the many hours of practice helped improve his technical skills on the guitar.
Conversely, absence of data can sometimes tell you a lot. In the example qualitative coding table, you can see that in week 1, there was no available data from Apoorva about their confidence in applying for jobs, but in week 12, it was clear from the participant's diary that they had applied for a job/training opportunity and been invited to an interview. When added to other data collection tools, you may be able to draw a conclusion from this omission of data at the baseline point about the participant's confidence (or lack of confidence) in applying for jobs at different points of the project.
Discovering unintended outcomes
The process of coding your data against your intended outcomes, then analysing it for evidence of progress is a top-down approach that focuses on expected findings.
You may also wish to take a bottom-up approach by coding any unintended outcomes that you identified through the process of reviewing the evidence.
For example, when reviewing reflective diaries, you may find that many of the participants talk about the impact of the project on their understanding of music professions and the music industry, although this was not an intended outcome of your project. In this case, you should go back through all your evidence and apply a new code for this unintended outcome to any relevant data. (If you already have a good idea of your unintended outcomes through your involvement with the project delivery, you may wish to begin applying this code from the outset.) Once you’ve completed this process, you can review all the data you coded within this outcome and analyse its content the same way that you did for your intended outcomes.
Once you’ve analysed all the different data tools, you’ll need to consider whether the evidence for each indicator supports the same conclusion about the level of progress toward the intended outcome. The technique of using multiple indicators and data collection tools in order to check your findings is called triangulation (because you need at least three different tools to draw robust conclusions).
Combining different perspectives and methods allows you to overcome the intrinsic biases or weaknesses of any single perspective or method.
Imagine you relied solely on your participants’ self-assessment of their musical skills to tell you about their progress: people are intrinsically biased, and you would have no way of knowing how accurate their self-assessments were. They might over-report their progress out of bravado or under-report due to a lack of self-confidence. If you combine the participants’ self-assessments with the music leaders’ assessments, you’ll have a much better idea of how much progress participants have made through the project.
As you triangulate your indicators and data collection tools, you may find that they have varying levels of agreement with each other. If they all support the same conclusion, your work is done – now you just need to write it up! However, more commonly, you will find that different tools don’t always match up in a straightforward way. In this case, your task will be to determine the true level of progress toward your intended outcome by considering the relative strengths and weaknesses of your different indicators and data collection tools.
Triangulation: an example scenario
Your intended outcome is increased employability skills, and your indicators are the participants’ self-assessment of these skills, the music leader’s assessment of the participants’ skills, and the level and number of accreditations achieved.
The participants’ self-assessment shows only a small increase in their skills, but the music leader reports that the participants have made significant progress in their employability skills, and the majority of the participants achieved Arts Award Bronze—the first time any of them has achieved a qualification in an arts subject.
Therefore, you will want to look more closely at the outlier: why do the participants’ self-assessments show only a small increase in their employability skills? Did they over-rate their skills at the beginning of the project or under-rate their skills at the end of the project? In either case, you should think about why this could be. What are the weaknesses of self-assessment that may have led the participants to over-rate or under-rate their skills?
Since the music leader’s assessment and the level and number of accreditations achieved both suggest that the participants have made significant progress toward this outcome, two out of the three indicators agree with each other. You may therefore conclude that progress has indeed been made.
You may find it helpful, if appropriate, to explore the participants reflections on this and discuss if they feel like progress has been made and even discuss how their self-assessment may have differed and why.
- Analysis is the process of converting your raw data from all your data tools —such as assessment forms, photos, and video diaries—into useful information to help you monitor and evaluate your project. This information can then be used as evidence of your progress toward your intended outcomes.
- Analysing quantitative evidence is done by converting your numerical data into averages and trends. Analysing qualitative evidence is more about pulling out themes and ideas that are relevant to your outcomes.
- Triangulation is the process of using multiple indicators and data collection tools in order to back up and confirm your findings. It involves combining different perspectives and methods to make allowances for any biases or weaknesses.
- The process of analysis will give you an idea of how well you are progressing towards your intended outcomes and how you think things might progress even further in the future. These findings and ideas are essential in evaluating the impact of your project.